2 min to read
(ENG) Corporate Analysis, Data Team Week 4
Written by CA-Data Team
📌 Topic Selection and Data Collection Planning
The CA Data Team continued its focus on the Environmental aspect of ESG, specifically Scope 1 carbon emissions. Each member emailed 10 companies to request data, but most were denied due to sensitivity. As a result, the team pivoted to practice data analysis using a Netflix dataset from Kaggle.
📊 Kaggle Data Practice: Netflix Dataset Analysis
✅ Goal: Each member developed a hypothesis and practiced Excel + Power Query analysis
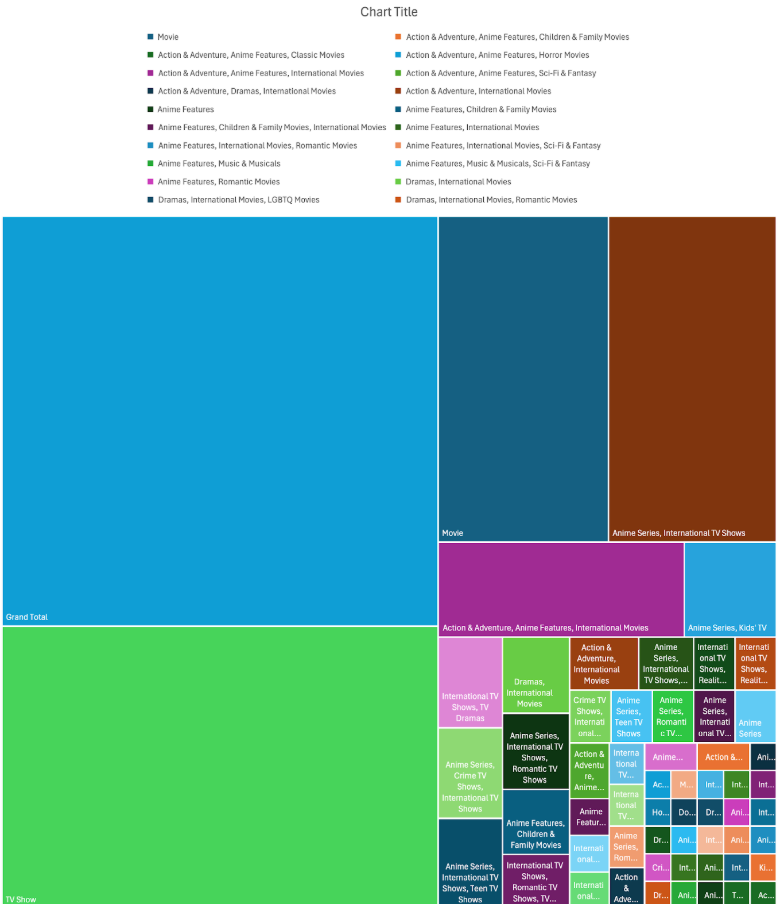
Jihee Lee
- Hypothesis: Most Japanese movies fall under horror/thriller/crime genres
- Used pivot table with Japan filtered; analyzed genre frequency
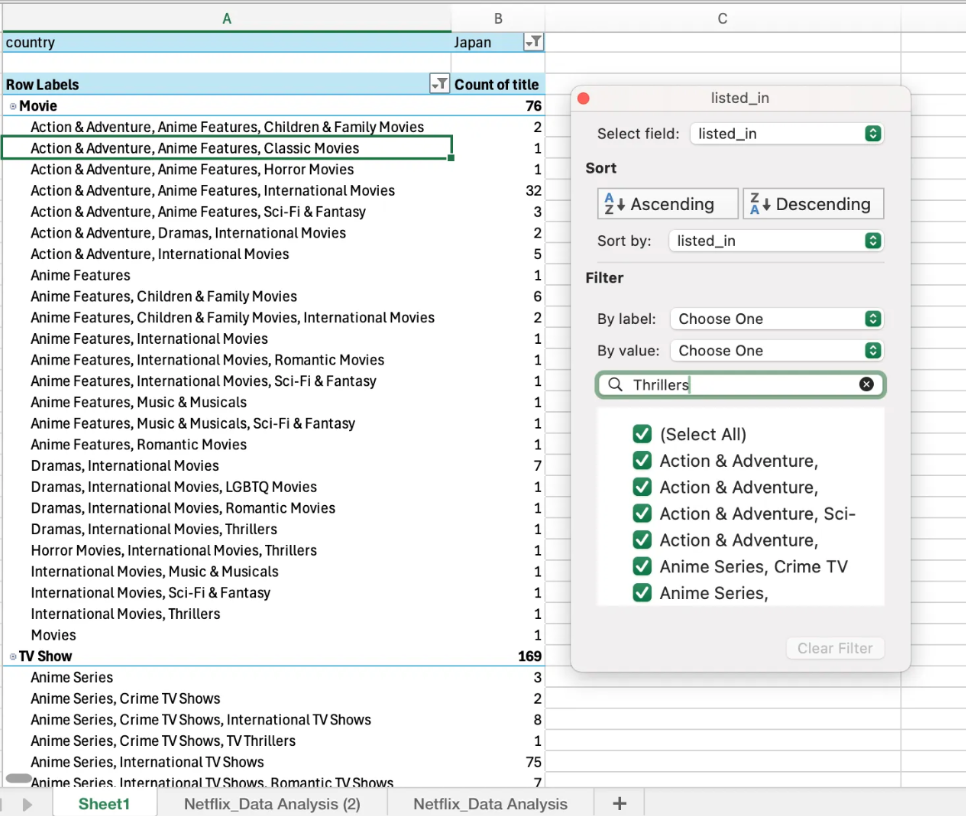
- Result: Only 21 out of 245 Japanese contents were horror/thriller related
- Conclusion: Hypothesis disproven; Anime Feature was the most common genre
- Visualization confirmed the small proportion of horror genres
Choi Onhyuk
- Hypothesis: Korea’s Netflix content includes more season-based TV shows than single movies
-
Used Power Query to filter South Korea → Grouped by content type
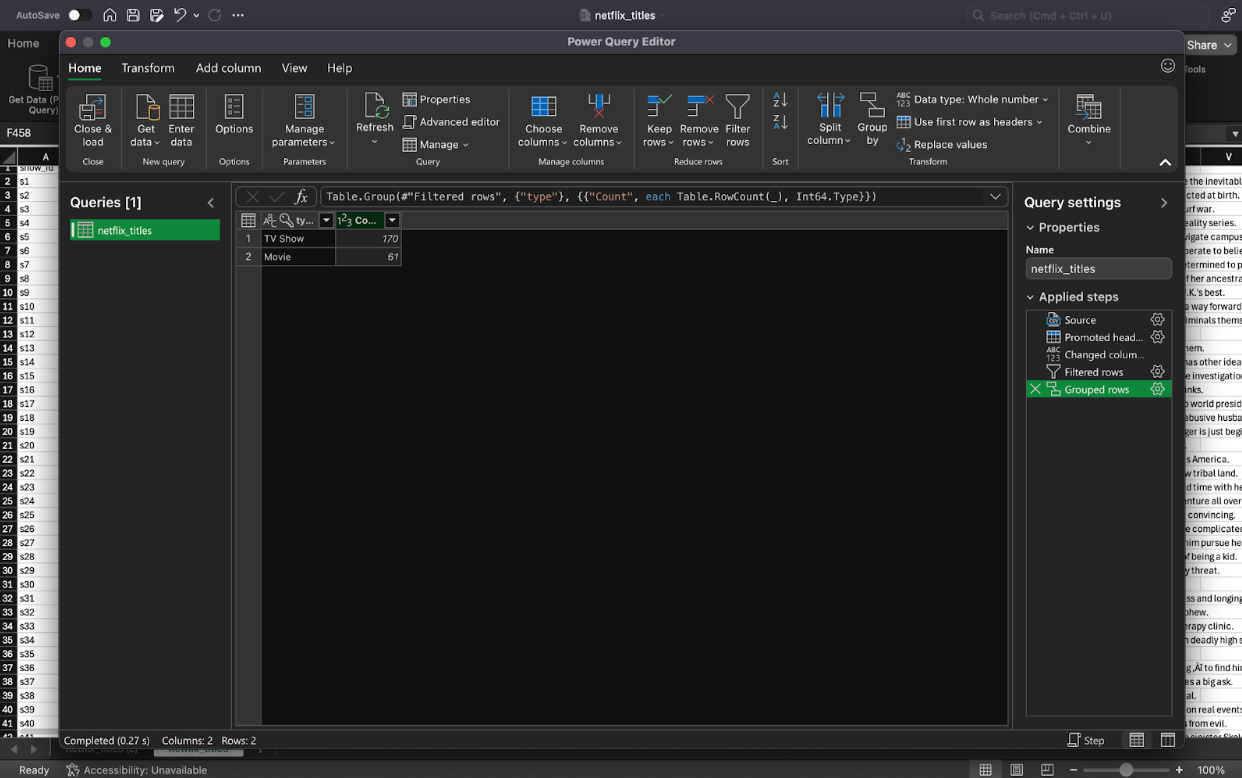
- Result: 170 TV Shows vs. 61 Movies → Hypothesis confirmed
- SQL query included for future expansion
SELECT type, COUNT(*) FROM netflix_titles WHERE country LIKE '%South Korea%' GROUP BY type;
Chaewon Jung
- Hypothesis: Crime is the most common genre among US TV Shows
- Filtered for TV Show + United States; split genres using delimiter
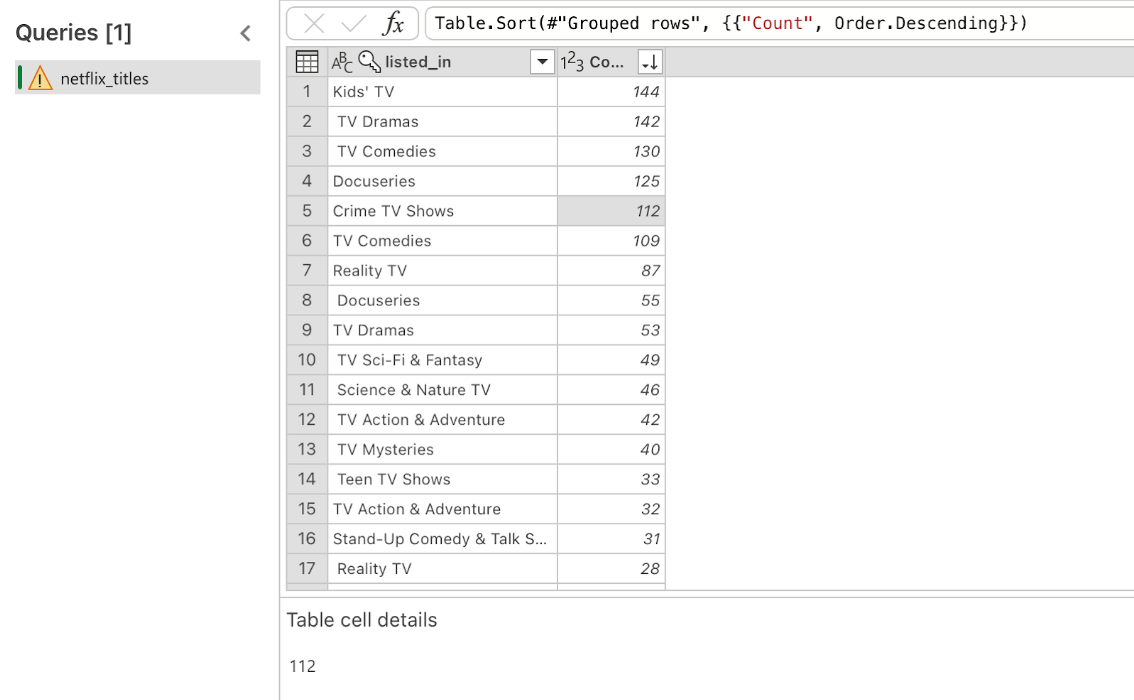
- Result: Kids’ TV was most common → Hypothesis disproven
Eunjae Kim
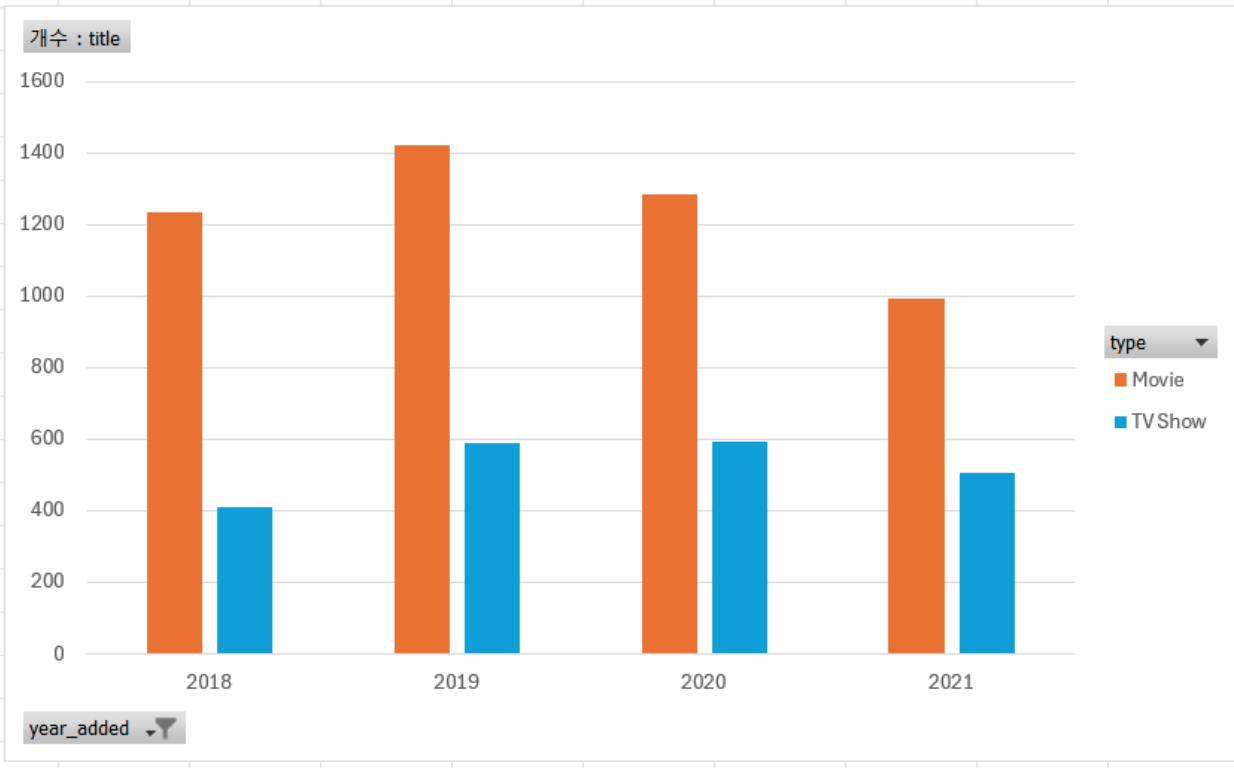
- Hypothesis: In 2020 (COVID era), there were more TV Shows than Movies
- Extracted year from date_added → Created pivot table
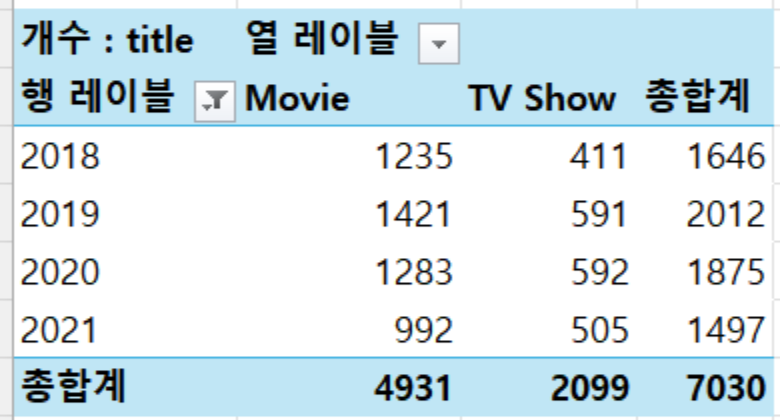
- Result: In 2020, Movies outnumbered TV Shows 2:1 → Hypothesis disproven
- Trend from 2018–2021 showed relative increase in TV Show share during COVID years
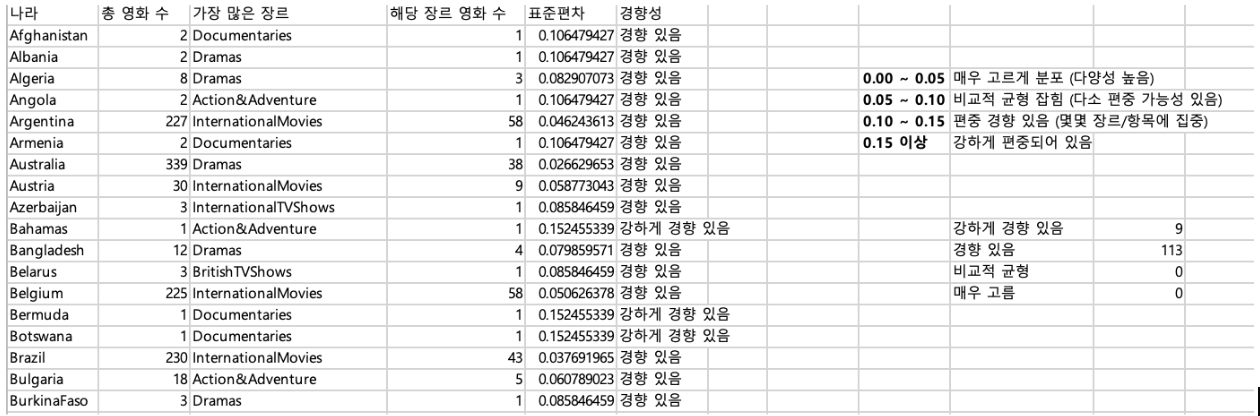
Woojin Shin
- Hypothesis: Specific countries tend to produce content concentrated in specific genres
- Used Power Query + Pivot table to analyze genre distribution by country
- Excel file attached for reference
Technical Skill Development
- Completed up to Day 2 of Power Query tutorials
- Enhanced analytical thinking through structured Kaggle exercises
Next Steps
- Finish Power Query Day 3
- Try more advanced analysis cases on Kaggle
- Discuss the possibility of shifting the project to a general data analysis theme (if ESG data remains limited)
- Each member will research and propose potential new topics of interest for future analysis

Comments